Data & Analytics
From Raw Data to Useful Insights
Useful dashboards begin with a decision, a clear definition, and data people can interpret.

A spreadsheet can contain accurate values and still leave a team unsure what to do next. Turning data into something useful involves more than choosing a chart. We need to know the question, understand how the records were created, and present the result with enough context to support a decision.
Start with a decision
“Show all our data” is too broad to guide a dashboard. “Which service requests need attention today?” gives the design a purpose. It identifies a user, a time window, and a possible action.
The same records may support different views for operations and planning. A daily queue needs specific items and status. A planning view may need a trend, but it still needs a consistent definition of what is counted.
Make definitions visible
Decide whether “completed” refers to the date work ended or the date someone updated the record. Clarify how cancelled items, missing values, and time zones affect the calculation. These are product decisions as much as data decisions.
Before adding a visual layer, inspect a few source records and reconcile the result manually. An attractive chart cannot repair a mismatch between what a metric says and what its query actually measures.
Choose a view that answers the question
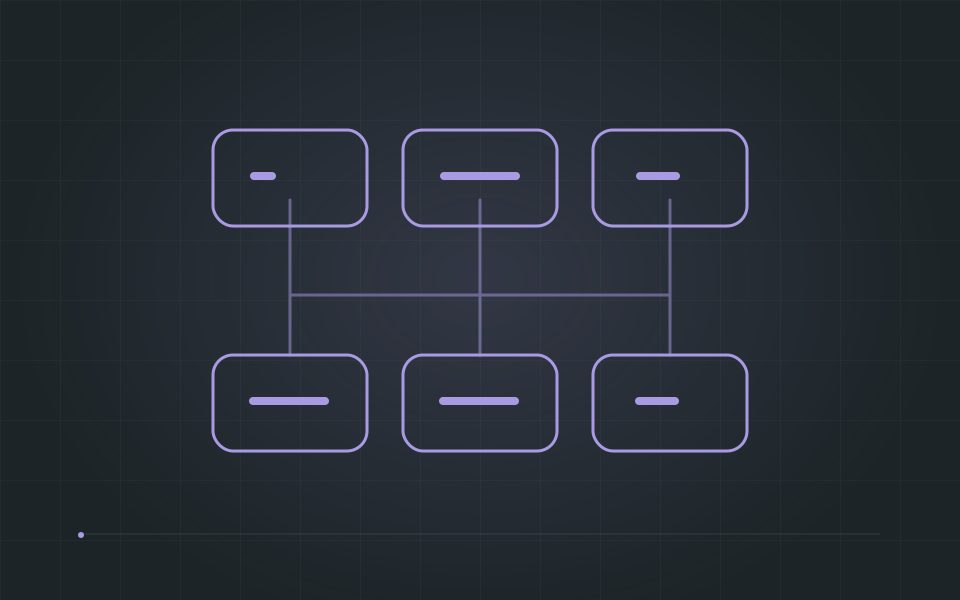
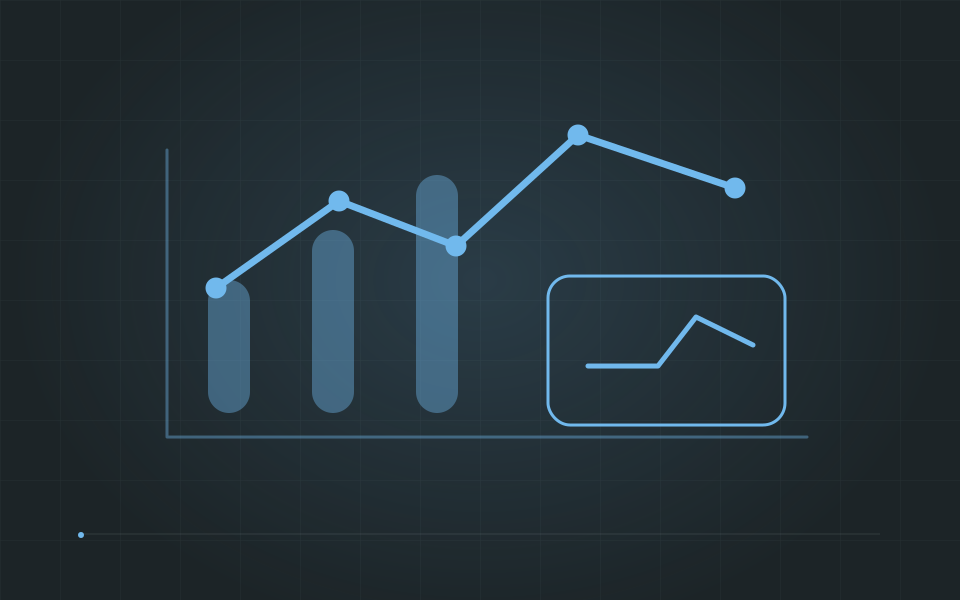
A table is often the right tool for finding a specific record. A line chart can reveal a trend over time. A network view helps explore relationships that would be difficult to follow in a flat list. Use the shape of the question to choose the view.
Give each visualization a readable label, meaningful units, and an explanation of filters. Provide a textual way to inspect important information so that color, motion, or precise pointer use is not the only way to understand it.
- Show the period and filters in effect.
- Keep comparisons on a consistent basis.
- Let users inspect the records behind a summary.
Keep the feedback loop open
Review the first version with the people making the decision. Ask what they noticed, which action they would take, and what they still cannot explain. Their answers are more useful than asking whether they like the colors.
A useful dashboard helps someone understand a situation and choose a next step. That purpose should remain visible as datasets and visualizations grow.
What Makes Software Architecture Sustainable?
Back