Collection and integration
Connect databases, files, and APIs while preserving provenance and ownership. Define what each source means before merging records.
 Get started
We process, analyze, and visualize data, from business records to large-scale datasets. We build the systems and pipelines that make data useful.
Useful analysis depends on information that arrives in the right shape and with a known meaning. We connect sources, clean and organize records, and build analytical interfaces around the questions your team needs to answer. Data engineering supplies the foundation; analytics explains it; visualization makes it possible to explore.
Connect databases, files, and APIs while preserving provenance and ownership. Define what each source means before merging records.
Resolve inconsistent formats, duplicates, missing values, and changing schemas. Make validation rules visible rather than silently discarding records.
Design repeatable ingestion and transformation jobs with retry, backfill, and monitoring. Choose where transformation happens according to the data platform.
Explore distributions, relationships, and variation. Distinguish an observed pattern from a causal conclusion and communicate uncertainty.
Give teams consistent definitions, useful comparisons, and drill-down paths. Reports should answer operational questions rather than display unrelated charts.
Explore connected entities and large datasets with appropriate indexes, aggregation, and interaction. Match processing choices to volume and update frequency.
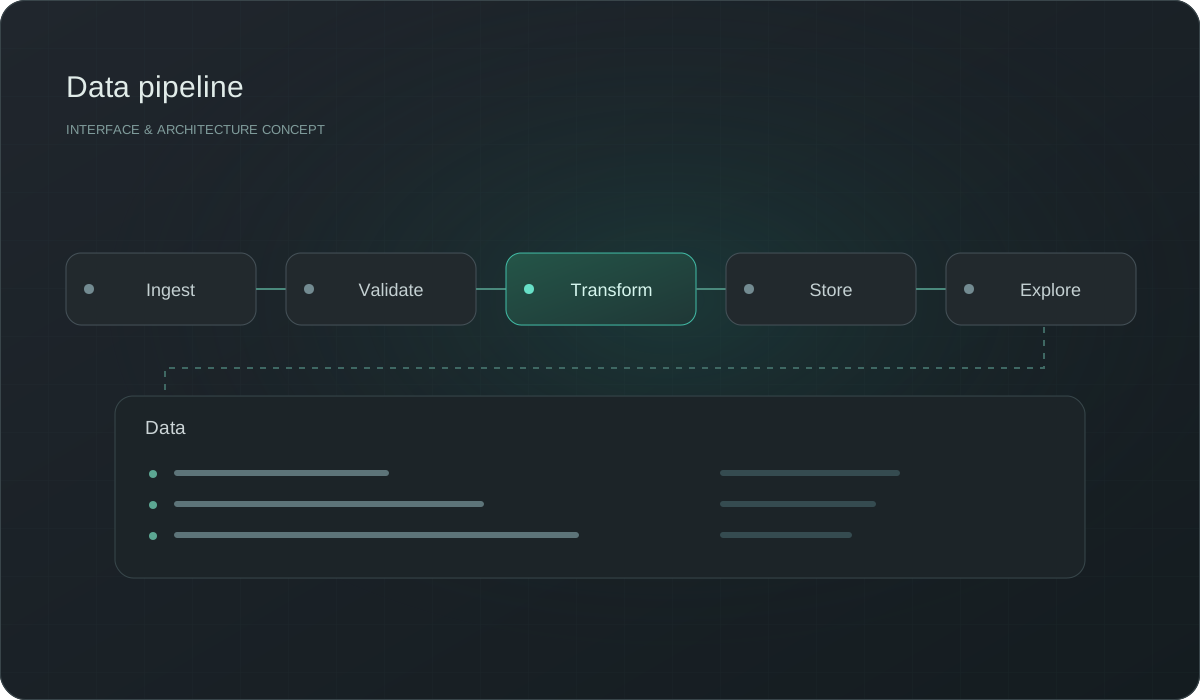
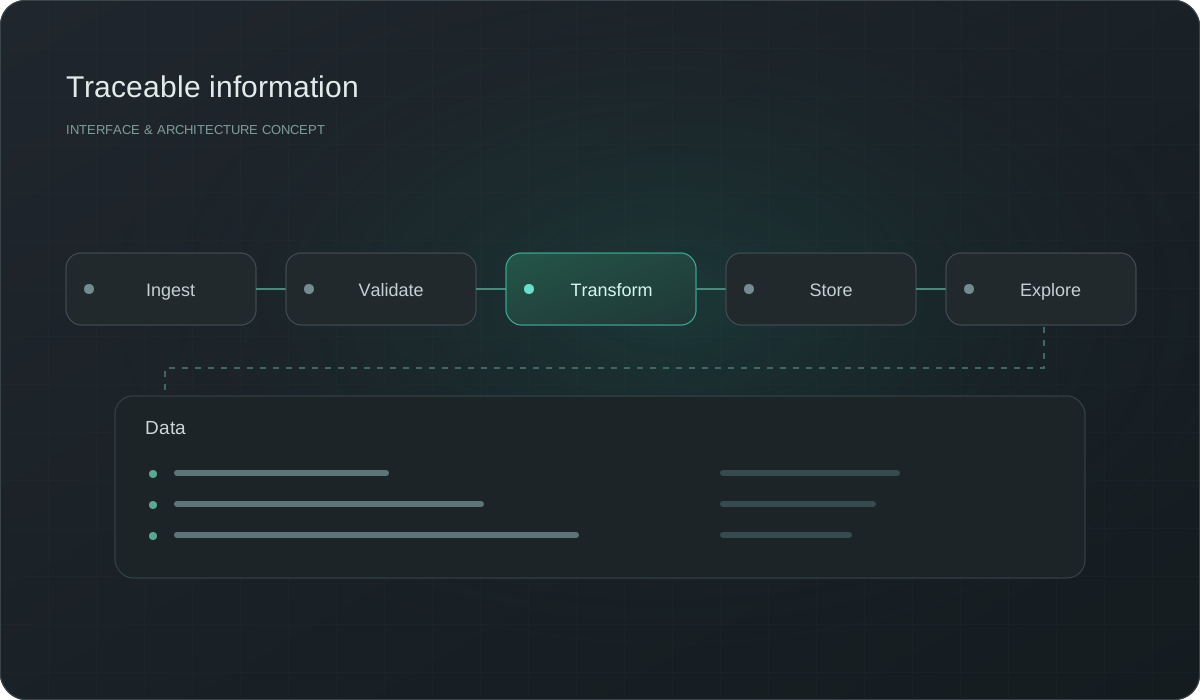
A failed source should not quietly become an incorrect report. We plan validation checkpoints, job history, and recovery paths. Batch or streaming processing is selected according to how quickly the business needs fresh information, not simply because a technology is available.
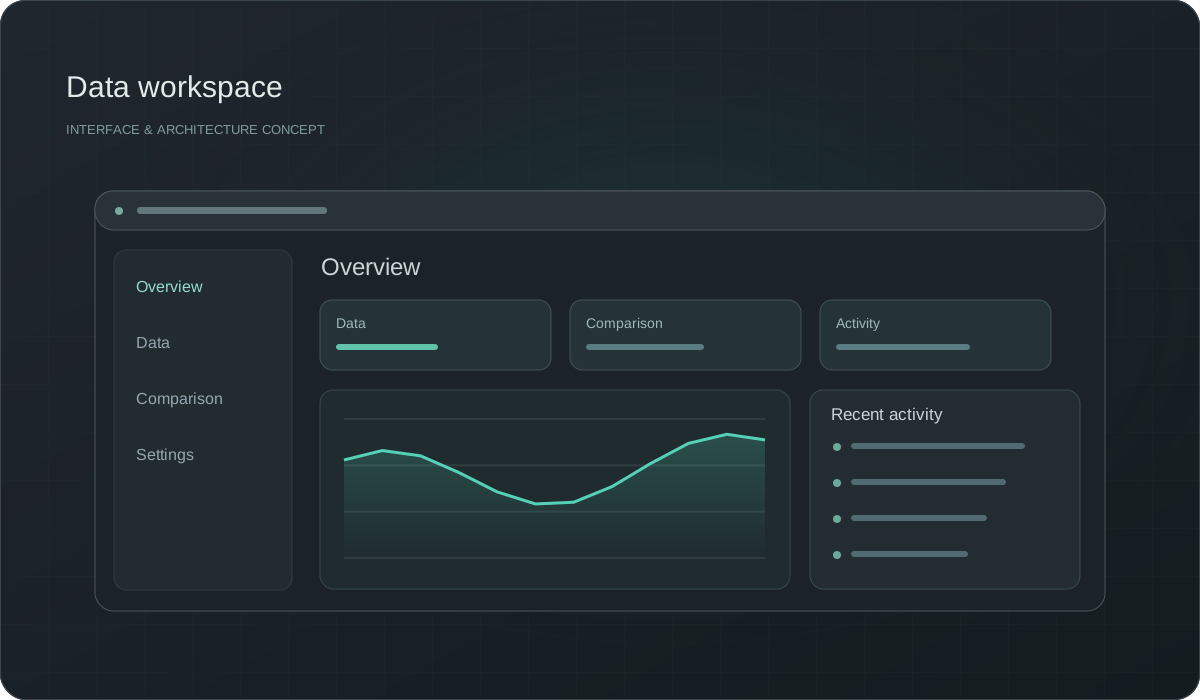
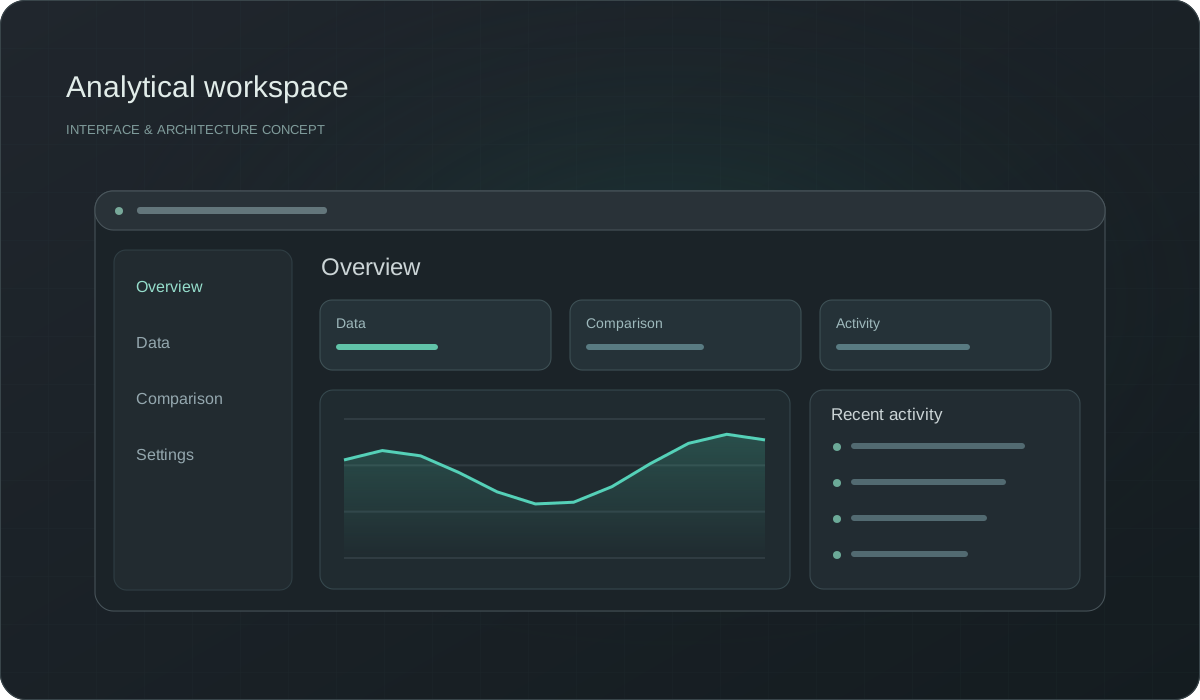
Interactive dashboards can compare periods, filter dimensions, and expose underlying records. For relationship-heavy data, a graph can be more useful than another table. We design visual exploration around the audience and make labels, units, and data freshness explicit.
We work from source definitions to the decisions the information needs to support.
Identify data owners, access boundaries, update patterns, and the decisions that are difficult today.
Build transformations with representative records and reconcile the results with people who understand the source systems.
Release dashboards and pipelines together with quality checks, ownership, and a process for changing definitions.
Keep important measures understandable across teams and reports.
Show gaps and freshness so users can judge how to use the information.
Let people move from a summary to the records or relationships behind it.
Engineering collects, moves, and organizes information reliably. Analytics interprets it to answer questions. Visualization is the interface that helps people explore and communicate those answers.
Yes. We first clarify definitions and quality, then decide whether a repeatable import is sufficient or a managed pipeline is needed. A large platform is not always the right starting point.
The update schedule depends on source access, processing cost, and business need. We make the expected freshness visible and select batch or streaming deliberately.
We assess volume, growth, query patterns, and available infrastructure. Partitioning, indexing, aggregation, and distributed processing are chosen from measured requirements.
Have an idea, a question, or a challenge to solve? Tell us what you need, and we'll help you find the right starting point.
Tell us what you have in mind. You can reach our team directly by email.
We'll take time to understand your needs, discuss the possibilities, and work out what makes sense for your project.
Tell us about your idea, your challenge, or your next project. We’ll help you find the right way forward.