Collection and ingestion
Plan source connectors, ingestion rates, validation, and replay for large or continuously arriving records.
 Get started
We build systems for collecting, processing, organizing, and visualizing large volumes of data. From scalable data pipelines to interactive visualizations, we help make complex datasets accessible and understandable.
Large datasets create practical questions about ingestion, storage, update frequency, and the cost of a query. We design processing and visualization systems around those constraints. The useful result may be an aggregate, an indexed search, a network graph, or a geographic view that helps people inspect relationships without loading every record into one screen.
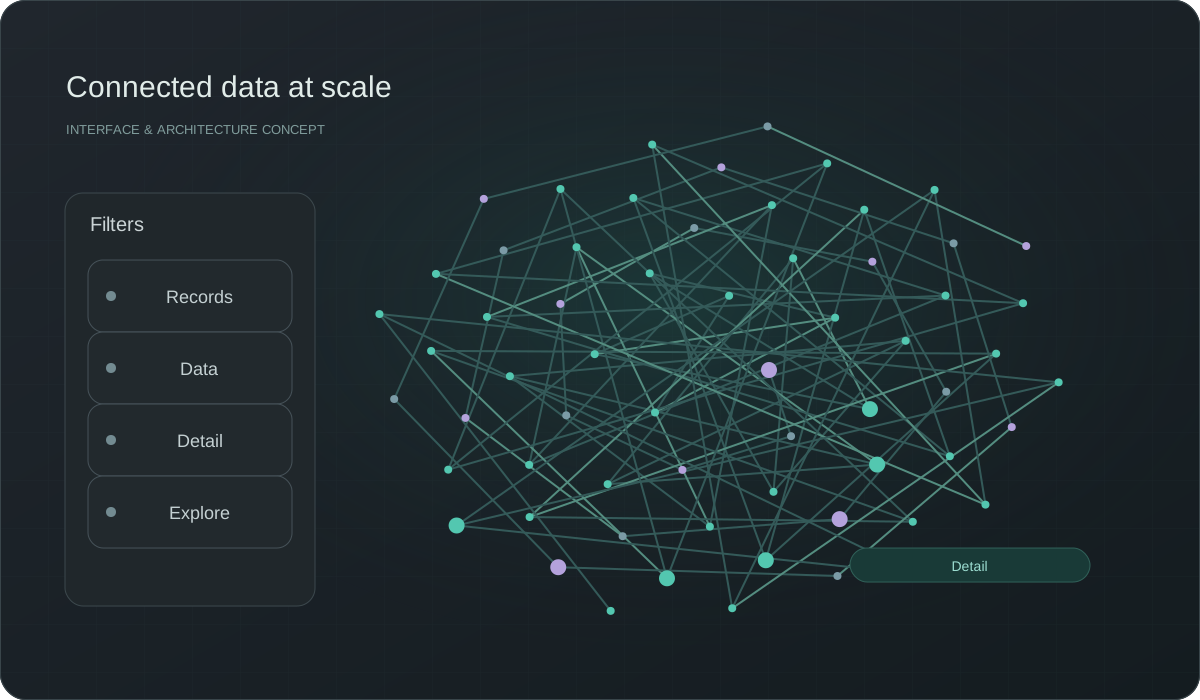
Plan source connectors, ingestion rates, validation, and replay for large or continuously arriving records.
Match processing windows, latency, and resource needs to the actual use case rather than assuming real time is always necessary.
Choose data layout, partitioning, indexes, and retention around expected queries and growth.
Use aggregation, graph-based views, geographic layers, and progressive detail to make complex information inspectable.
Volume alone does not determine the architecture. Record size, update frequency, query shape, and recovery needs matter together. We evaluate representative data and choose batch jobs, streaming stages, or distributed processing where justified, with checkpoints and observability for operations.
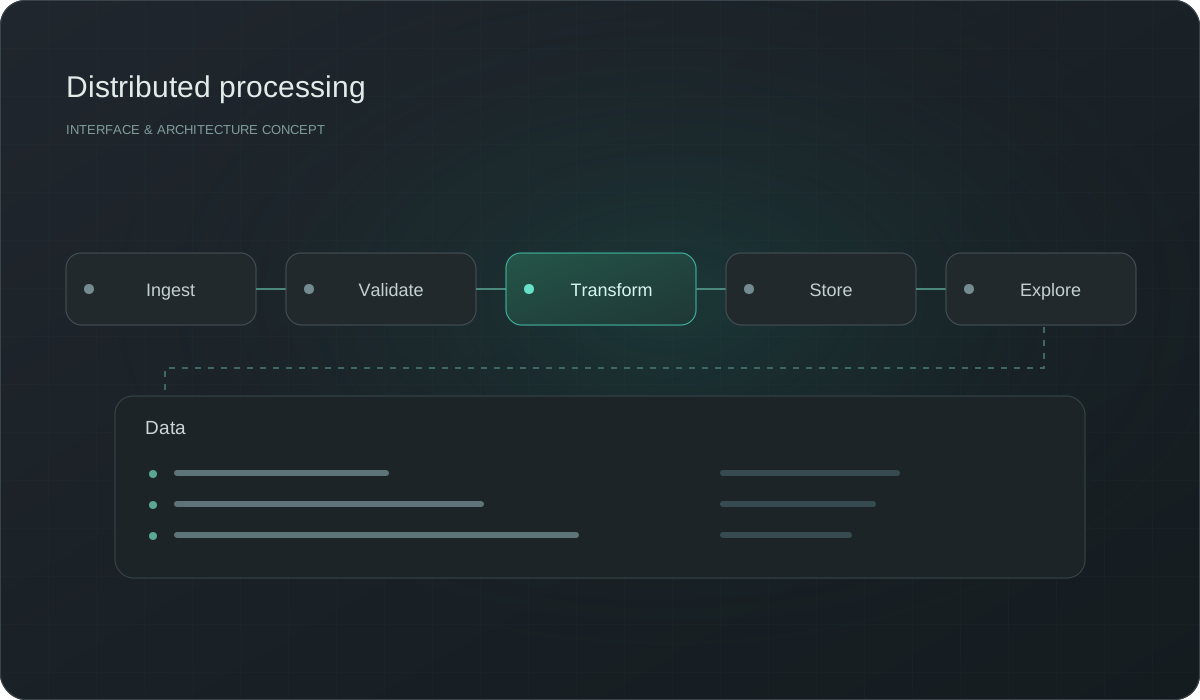
A graph or map can reveal structure that a table hides, but it still needs interaction limits and clear meaning. We design filtering, clustering, selection, and drill-down so users can move from a broad pattern to a specific entity. Visual performance is evaluated on the intended devices and dataset.
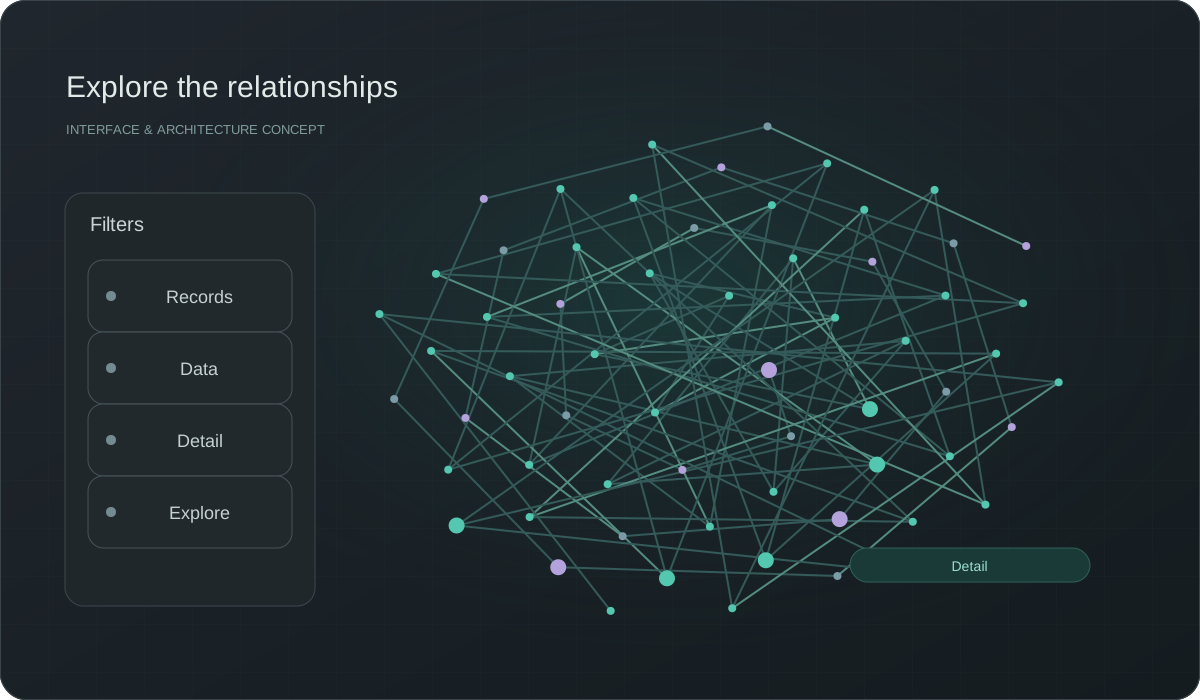
Capacity decisions need measured workloads and explicit limits.
Measure volume, growth, source behavior, query patterns, and retention needs.
Test ingestion, processing, and visualization with representative records and failure cases.
Track pipeline health, storage use, query performance, and recovery procedures.
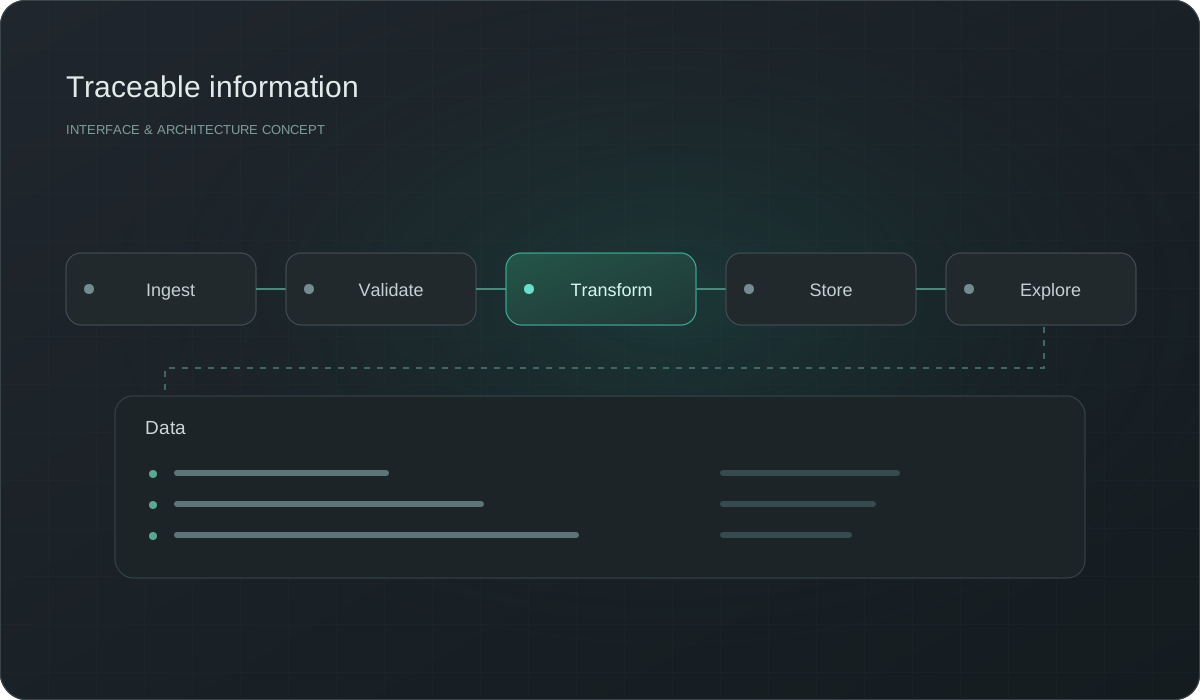
Choose resources and processing from observed needs.
Let people inspect context instead of facing an undifferentiated dataset.
Document supported workloads and the path to further growth.
That depends on data shape, queries, infrastructure, and interaction requirements. We validate representative workloads rather than promising an unlimited size.
No. Streaming adds operating complexity. We use it when the business needs information sooner than a suitable batch schedule can provide.
Yes, with suitable indexing, filtering, aggregation, and rendering choices. The interaction is designed and tested against the intended dataset and devices.
This area emphasizes collecting, processing, storing, and exploring demanding datasets. Business analytics focuses more directly on interpreting measures and supporting decisions.
Have an idea, a question, or a challenge to solve? Tell us what you need, and we'll help you find the right starting point.
Tell us what you have in mind. You can reach our team directly by email.
We'll take time to understand your needs, discuss the possibilities, and work out what makes sense for your project.
Tell us about your idea, your challenge, or your next project. We’ll help you find the right way forward.